What is a lifecycle?
In product terms, it’s the journey a customer goes throughout their customer experience. It’s their circle of life.

Where my head jumps to immediately when I hear “circle of life”
The lifecycle begins even before a customer knows about the product and until they churn and never use the product again. However, for data reasons, we begin tracking the journey once they signup so for many the lifecycle begins at “Signup”. Understanding where our customers are in their lifecycle is key to delivering personalized experiences.
But, why do we care about personalization?
Why is personalization important?
The ultimate goal for most data science, product, and marketing teams is personalization. It’s because of the numerous benefits from financial to product retention and ultimately the brand. Personalization maximizes retention, LTV, and all other important metrics. The foundation of personalization is segmentation.
Why don’t more companies do it? There’s an assumption of complexity and usually a lack of resources to implement it. But, segmentation neither has to be complex or resource intensive. There’s a simple and beautiful framework called RFM that achieves 85-90% of what you’ll need. RFM stands for Recency, Frequency, and Monetary. If you combine RFM with a Lifecycle framework you’ll get a complete way to segment all of your users.
Recency → When was their last purchase?
Frequency → How many purchases over a certain period?
Monetary → How much money was spent over a certain period?
How Uber Segments 161M+ Customers
Uber uses a Lifecycle + RFM framework to segment all of their users. The 161M+ refers to the Monthly Active Platform Customers from their last earnings call so the real number is likely closer to 300M+.
Note: None of the numbers, thresholds, segment names are actually what Uber uses. I can’t share those, but I can share the framework we used.
First, let’s explore the lifecycle of an Uber customer. The terms I use will be for Rides (Mobility), but it can easily apply to UberEATS (delivery).

An Uber customer has the following journey:
They signup
They either “Churn” and never take a trip OR
They take their first trip
They either “Churn” and never take a 2nd trip OR
They take their 2nd trip
They either “Churn” and never take a 3rd trip OR
They take their 3rd trip
And it goes on forever
This journey looks repetitive with “Taking a Trip” or “Churn”, but a customer who churns before their first trip is very different from a customer who churns after their first trip. To account for this, we combine Lifecycle, which tells us where a customer is on their journey, with RFM, which tells us how valuable a customer is.

Uber customer lifecycle
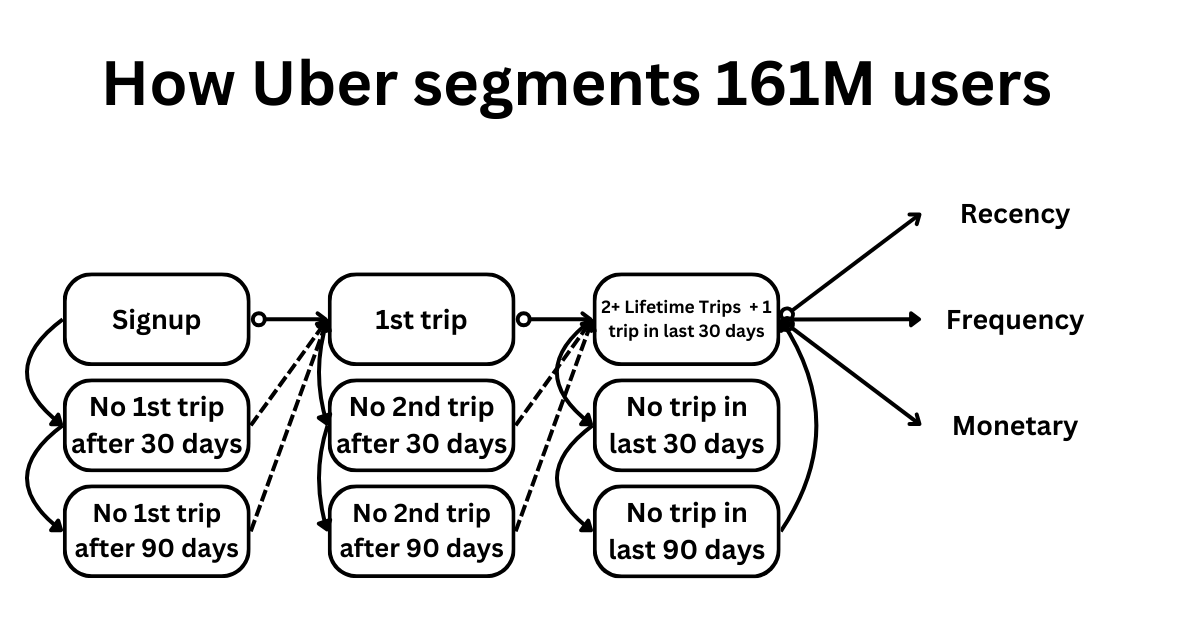
There are 3 key moments in a customer’s journey at Uber: Signup, 1st Trip, 2nd Trip. Once a user takes their 1st trip, they become a “1st Tripper”. They are no longer just a Signup but their stage and experience with the product has changed. Once a customer takes their 2nd trip, they’ve unlocked a new stage. We’ll call that stage a ”Sticky” customer. What happens if a customer churns after taking their 1st trip? Is that different than if they churned after taking their 2nd trip? Yes. We need to add more nuance to the segmentation.
Uber’s segmentation framework
This is Uber’s complete segmentation framework. Every customer will fall into one of these segments so the framework is Mutually Exclusive, Collectively Exhaustive. Good ole MECE. There is no doubt about where a customer is on their journey.
Example
Date | Action | Segment |
|---|---|---|
January 1st | Jane Doe signs up | Signup |
February 1st | None | Segmentation changes: No 1st trip after 30 days |
February 5th | Jane Doe takes 1st trip | Segmentation changes: 1st trip |
February 8th | Jane Doe takes 2nd trip | Segmentation changes: 2+ Lifetime trips + 1 trip in last 30 days |
March 9th | None | Segmentation changes: 2+ Lifetimes Trips No trip in last 30 days |
The best part about this framework is that customers progress through the lifecycle framework from left to right. They can not go backwards. This creates a flow from one stage to another and a clear understanding of exactly where a customer is on their journey.
Now let’s dig into the customer who has taken 2+ lifetime trips and 1 trip in the last 30 days. That’s where the RFM framework comes in.
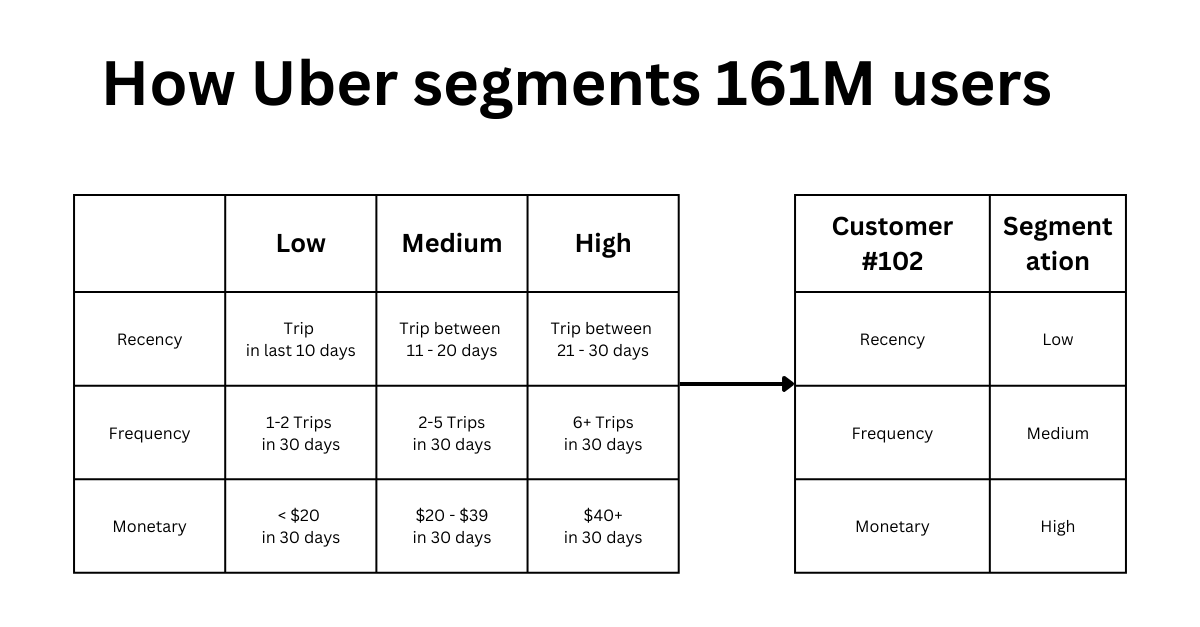
The RFM framework and example of how to categorize a customer
For each category, we can create a simple low, medium, and high segment. We can apply thresholds that define each of these segments and allow for easy categorization. Let’s look at the example for Customer #102 (random customer):
Low Recency
Medium Frequency
HIgh Monetary
They have:
Recency → taken a trip in the past 10 days
Frequency → 2-5 trips in 30 days
Monetary → Spent over $40+ in 30 days
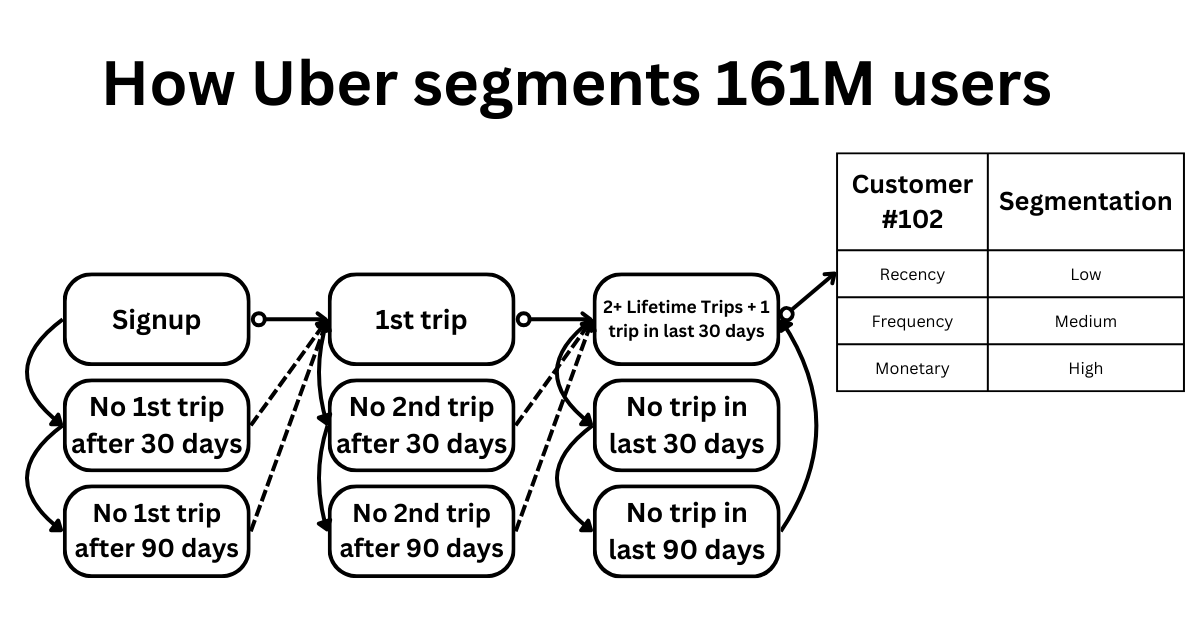
It could be that they are a consultant that takes frequent trips to the airport. But, we can now tailor our communications and marketing based on our knowledge of them. Piecing it all together, here’s what it looks like:
Why didn’t Uber go with a more complicated segmentation model? They have all the data and the best data scientists. There are a variety of reasons:
3rd Party Data → Uber runs a global business and the quality of data across countries is not always consistent. We couldn’t rely on demographic data being reliable. In addition, it requires costs and resources that weren’t always available.
Functional → Operations, Marketing, and Product all have different goals. Marketing needed a specific framework to deliver better product and lifecycle marketing. This is not the same as what product needs. The cooperation required to have Ops, Marketing, and Product to align is too much for a company of Uber’s size. They actually tried to at one point and the person leading that lasted less than a year.
Speed vs Value → A segmentation like the one above will capture about 75 - 80% of the value of segmentation. You’re using behavioral data to influence behavior and that’s good enough. The last 20 - 25% is by going deeper into a customer’s psychology and that goes back to the issue above on 3rd party data.
How you can design your segmentation
Segmentation always seems more complex than it needs to be. But with a lifecycle + RFM framework you can set one up in no more than a week.
Here are the steps:
Decide the lifecycle steps
Set additional thresholds between lifecycles
Set the thresholds for RFM
Decide the lifecycle steps
This is straightforward as most products are quite linear.
Signup
1st key action (Trip, Song Played, Product bought, Content posted, etc.)
2nd+ key action
Churn
Bonus: If you have a clear idea of a “Sticky” or “Magic” number then add that to your lifecycle. For example, at Facebook it was “Added 7 friends in 10 days”.
Set additional thresholds between lifecycles
How did we decide that after 30 days and after 90 days were 2 different sub lifecycles? Data 😃.
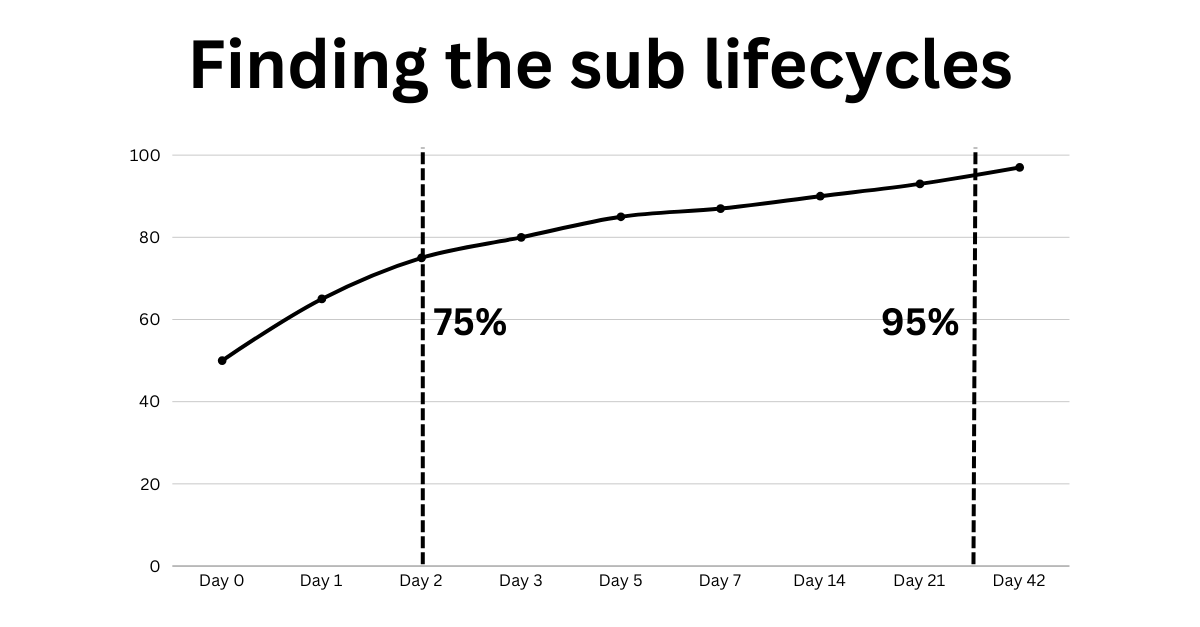
Days from Signup to 1st Trip (Cumulative density)
The above is a chart of days from Signup → 1st trip. It plots the # of days on the X axis and the Cumulative % of all conversions on the Y Axis. In the example above, 75% of all Signup → 1st Trip conversions happen on Day 2. 95% happen after Day 35.
We can use these thresholds to make lifecycle segmentations that are more nuanced. Anyone before 75% is a “New Signup”. Everyone between 75% and 95% is a “Signup but soft churn intent”. Everyone after 95% is “Signup but hard churn intent”. You can imagine the win back strategy looks very different for those 2 thresholds. Now, do the same thing for between 1st and 2nd trip and then 2+ trips to next trip. You can define Churn thresholds based on plotting data and using percentiles to understand the average customer behavior.
Set the thresholds for RFM
For Recency, Frequency, and Monetary there are two approaches:
Use common sense and ballpark estimates for good cutoffs
Use a more mathematical approach based on standard deviations or percentiles
You’ll be surprised to hear that I advocate for either. There’s nothing wrong with using common sense to say I want one segment for anyone who took a trip in the last week, last 2 weeks, and last 4 weeks as your cutoffs. They’re easy to explain and in line with customer behavior.
If you want to use a more mathematical approach then plot a distribution of recency, frequency, and monetary. Use a 33% percentile and 66% percentile to make your cutoffs. Or use another percentile if you prefer. Don’t complicate it.
If you’ve done all of this, here are some bonus attributes you can attach to your customers so that you build even more personalized experiences:
Mobile vs web usage
Product usage
time of day / day of week
product type
Geography
These are all 1st party attributes that help you customize and personalize without needing an army of data scientists.
Takeaways
That’s it for this week, friends! Some key takeaways:
Personalization unlocks higher LTVs. Segmentation is the foundation of personalization.
Segmentation doesn’t have to be complicated.
Was this article helpful?
Check it out: When to join Marketing at a startup


